Power BI EHS Dashboards
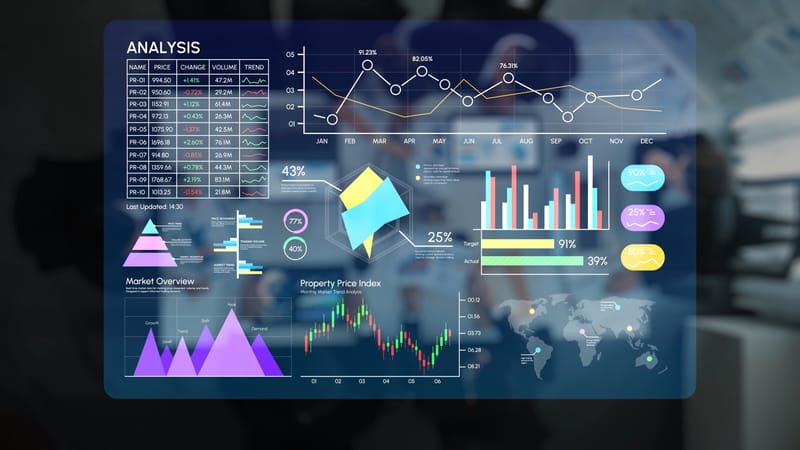
Command Post Safety develops Power BI dashboards that give leadership a straightforward view of EHS performance. The dashboard can track leading indicators such as inspections completed, hazards reported, corrective-action closure, training activity, safety observations, and management participation alongside lagging indicators such as incidents, recordable cases, lost-time cases, severity, and trends over time. By consolidating available safety data into visual scorecards and trend views, teams can identify developing issues, focus resources, and monitor follow-through. Dashboard scope, indicators, and reporting views are tailored to the organization’s operations, priorities, and available data.